

Click Setup menu and then Display item. The following dialog window appears:
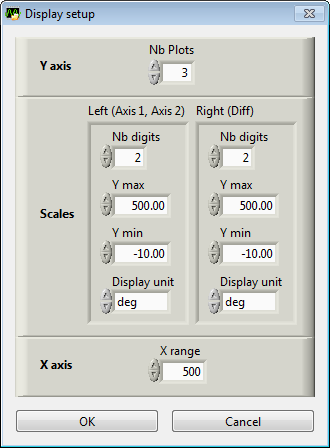
1. The number of plots to display depends on the Axis Setup.
· if only one encoder is connected, set Nb Plot to 1
· if two encoders are connected, but measurement are not of the same type (angular vs. linear), you can only set Nb Plot to 1 or 2.
· If two encodes are connected, and measurements are of the same type (both linear or both angular), you can set Nb Plot to 3 to display the difference between Axis 2 and Axis 1
2. Select the number of digits you need (minimum=0, maximum=4).
3. Adjust Ymin and Ymax values to enable complete trajectory display for left and right Y scales. These values are expressed in Display Unit.
4. Select the Display Unit you want to see for left and right Y scales. Available values for this selector depend on Axis Setup.
5. Adjust Xrange value according to scan rate used. Xrange is expressed in number of samples.
6. Validate with Ok button, or press Cancel button.
Remarks
· To save the parameters values for next session, click Save Preferences item in Setup menu.
See Also