

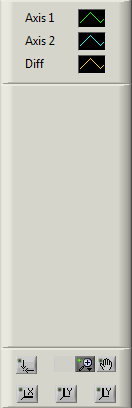
On main window's right side, the following panel appears:
·
The legend box allows you to modify curves’
appearance.
- display data points
- display line
- point attributes (symbol, color)
- line attributes (type, thickness, color)
·
The graph and scale box allow you to modify
graph scaling and display.
- reset the default scale configuration
- select zoom
- select hand tool, to move into graph
- auto-scale graph on X, left Y or right Y scale